Python 3.5.2 |Anaconda 4.2.0 (32-bit)| (default, Jul 5 2016, 11:45:57) [MSC v.1900 32 bit (Intel)]
Type "copyright", "credits" or "license" for more information.
IPython 5.1.0 -- An enhanced Interactive Python.
? -> Introduction and overview of IPython's features.
%quickref -> Quick reference.
help -> Python's own help system.
object? -> Details about 'object', use 'object??' for extra details.
In [1]:
In [1]:
In [1]: import numpy as np
...: import matplotlib.pyplot as plt
...:
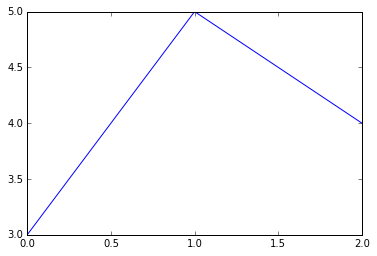
In [2]: plt.plot([3, 5, 4])
...:
Out[2]: [<matplotlib.lines.Line2D at 0xc87c9f0>]
In [3]: plt.axis([-1, 4, 0, 6])
...: plt.plot([1, 1.5, 3], [3, 5, 4], "ro") #punased mummud
...:
Out[3]: [<matplotlib.lines.Line2D at 0xc8ded90>]

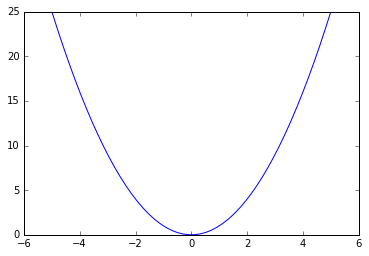
In [4]: xid=np.linspace(-5, 5, num=50)
...: yid=xid*xid
...: plt.plot(xid, yid)
...: plt.savefig('d:/jaagup/17/01/j3.png')
...:
In [5]: plt.plot(xid, yid)
...: plt.fill(xid, -yid, color="g")
...: plt.text(0, 10, "ruutfunktsioonid", horizontalalignment='center')
...: plt.title("Kaks joont", fontsize="20")
...: plt.xlabel("temperatuur")
...: plt.ylabel("soojusvahetus")
...: plt.yticks(np.linspace(-30, 30, 10))
...:
Out[5]:
([<matplotlib.axis.YTick at 0xc922d30>,
<matplotlib.axis.YTick at 0xc9503f0>,
<matplotlib.axis.YTick at 0xc959c90>,
<matplotlib.axis.YTick at 0xd084870>,
<matplotlib.axis.YTick at 0xd084e30>,
<matplotlib.axis.YTick at 0xd08a410>,
<matplotlib.axis.YTick at 0xd08a9d0>,
<matplotlib.axis.YTick at 0xd08af90>,
<matplotlib.axis.YTick at 0xd090570>,
<matplotlib.axis.YTick at 0xd090b30>],
<a list of 10 Text yticklabel objects>)

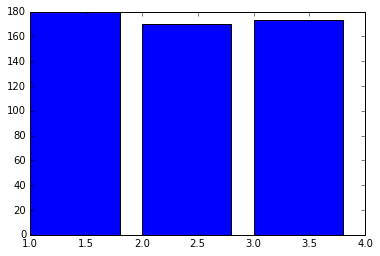
In [6]: plt.bar([1, 2, 3], [180, 170, 173])
...:
Out[6]: <Container object of 3 artists>
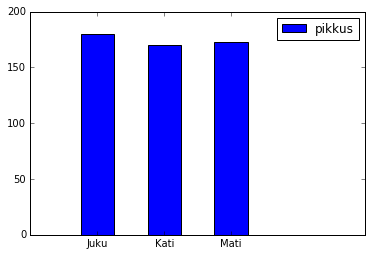
In [7]: plt.axis([0, 5, 0, 200])
...: tulbad=plt.bar(np.array([1, 2, 3])-0.25, [180, 170, 173], width=0.5)
...: plt.xticks([1, 2, 3], ["Juku", "Kati", "Mati"])
...: plt.legend((tulbad[0],),("pikkus", ), loc='upper right')
...:
Out[7]: <matplotlib.legend.Legend at 0x16344f0>
In [8]: plt.pie([75, 60, 85])
...:
Out[8]:
([<matplotlib.patches.Wedge at 0x167ef30>,
<matplotlib.patches.Wedge at 0x16856b0>,
<matplotlib.patches.Wedge at 0x1685df0>],
[<matplotlib.text.Text at 0x1685410>,
<matplotlib.text.Text at 0x1685b50>,
<matplotlib.text.Text at 0x168a2b0>])
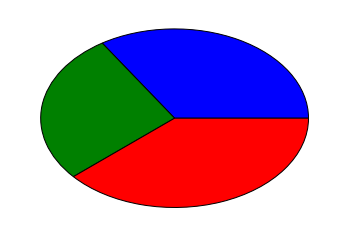
In [9]: plt.pie([75, 60, 85], labels=["Juku", "Kati", "Mati"])
...:
Out[9]:
([<matplotlib.patches.Wedge at 0x16bb490>,
<matplotlib.patches.Wedge at 0x16bbbf0>,
<matplotlib.patches.Wedge at 0x16c1350>],
[<matplotlib.text.Text at 0x16bb950>,
<matplotlib.text.Text at 0x16c10b0>,
<matplotlib.text.Text at 0x16c17f0>])

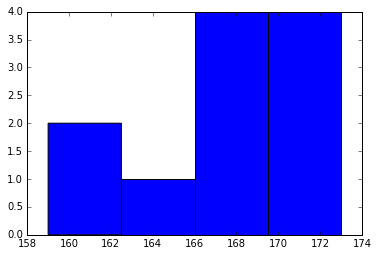
In [10]: pikkused=[159, 162, 165, 167, 167, 168, 169, 171, 171, 171, 173]
...:
In [11]: plt.hist(pikkused, bins=4)
...:
Out[11]:
(array([ 2., 1., 4., 4.]),
array([ 159. , 162.5, 166. , 169.5, 173. ]),
<a list of 4 Patch objects>)
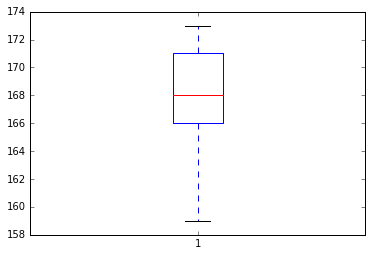
In [12]: plt.boxplot(pikkused)
...:
Out[12]:
{'boxes': [<matplotlib.lines.Line2D at 0x1732350>],
'caps': [<matplotlib.lines.Line2D at 0x1732eb0>,
<matplotlib.lines.Line2D at 0x1737390>],
'fliers': [<matplotlib.lines.Line2D at 0x1737d10>],
'means': [],
'medians': [<matplotlib.lines.Line2D at 0x1737c30>],
'whiskers': [<matplotlib.lines.Line2D at 0x17324b0>,
<matplotlib.lines.Line2D at 0x17329f0>]}
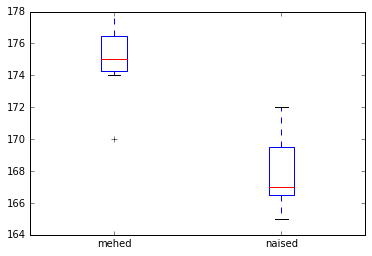
In [13]: jooksjad=[[175, 177, 178, 175, 174, 170], [167, 168, 166, 165, 167,171, 172]]
...:
In [14]: plt.hist(jooksjad, bins=3)
...:
Out[14]:
([array([ 0., 1., 5.]), array([ 5., 2., 0.])],
array([ 165. , 169.33333333, 173.66666667, 178. ]),
<a list of 2 Lists of Patches objects>)

In [15]: plt.boxplot(jooksjad, labels=["mehed", "naised"])
...:
Out[15]:
{'boxes': [<matplotlib.lines.Line2D at 0x17b6c70>,
<matplotlib.lines.Line2D at 0x17c1ed0>],
'caps': [<matplotlib.lines.Line2D at 0x17bc7f0>,
<matplotlib.lines.Line2D at 0x17bccb0>,
<matplotlib.lines.Line2D at 0x17c7950>,
<matplotlib.lines.Line2D at 0x17c7e10>],
'fliers': [<matplotlib.lines.Line2D at 0x17c1650>,
<matplotlib.lines.Line2D at 0x17cd7b0>],
'means': [],
'medians': [<matplotlib.lines.Line2D at 0x17c1570>,
<matplotlib.lines.Line2D at 0x17cd6d0>],
'whiskers': [<matplotlib.lines.Line2D at 0x17b6dd0>,
<matplotlib.lines.Line2D at 0x17bc330>,
<matplotlib.lines.Line2D at 0x17c1fb0>,
<matplotlib.lines.Line2D at 0x17c7490>]}
In [16]: