The following information has been obtained from studies of the blue whale and enables us to build a Leslie model of the population.
The following table gives the estimated fertility and mortality rates for the age distribution of the animal.
|
Age of Whale |
Fertility Rate |
Mortality Rate |
|
0- |
0.00 |
0.13 |
|
2- |
0.00 |
0.13 |
|
4- |
0.19 |
0.13 |
|
6- |
0.44 |
0.13 |
|
8- |
0.50 |
|
|
10- |
0.50 |
0.13 |
|
12- |
0.45 |
0.13 |
|
14- |
0.45 |
0.13 |
|
16- |
0.45 |
0.13 |
|
18- |
0.45 |
0.13 |
|
20- |
0.45 |
0.13 |
|
22- |
0.45 |
0.13 |
|
24- |
0.45 |
0.13 |
|
26- |
0.45 |
0.13 |
|
28- |
0.45 |
0.13 |
|
30- |
0.45 |
0.13 |
|
32- |
0.13 |
|
|
34- |
0.45 |
0.13 |
|
36- |
0.45 |
0.13 |
|
38- |
0.00 |
1.00 |
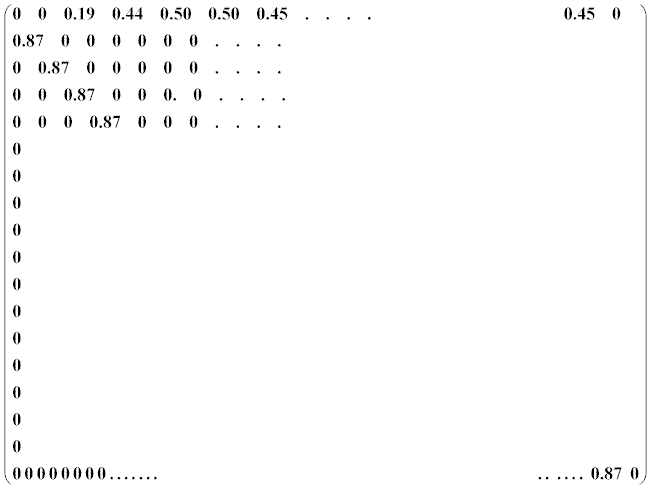
The information in the table gives rise to the following Leslie matrix M of order 20.

Using the Maple commands
will give the Eigenvalues and Eigenvectors of the matrix M. The eigenvalues are shown and the command • x:= col(vecs,n); gives the eigenvector corresponding to the nth eigenvalue.
In our case M is the above Leslie matrix.
Running the command gives the results shown below:
Eigenvalue ![]() =
1.112535559
=
1.112535559
The corresponding eigenvector x ={-0.6233088368, . . . . . . . -0.007454178041, 0}
The corresponding population, normalised to give 1000 members in the
first class is
{1000, 782, 612, 478, 374, 292, 229, 179, 140, 109, 86, 67 ,52, 41, 32,
25, 20, 15, 12, 0}