

WORKSHEET 4 THE DRILL (3)
Modify worksheet 2 such that the waiting area prior to the drill can hold a maximum of 5 jobs. Jobs which arrive when the waiting area is full are counted and balked from the system. Also, change the arrival process such that the time between arrivals is exponential with mean 4, 40% being type 1 and 60% being type 2.
Also add an inspection process following the drill. The time follows a triangular distribution with values of 2, 4, 6 for job type 1 and 1, 2, 3 for job type 2. The probability of a failed part is 10% and is independent of part type. The failed parts are rejected. After every 20 parts the inspection machine must be shut down and cleaned for 20 minutes. The drill operator also requires a 15 minute break every 2 hours.
Count the number of jobs which are balked from the system and the number of jobs which fail inspection. Collect additional statistics on the inspection queue and the inspection and cleaning processes. Make three runs of 1 eight hour day each and 1 run of 10 eight hour days.
New model statements to include :
ALTER, BRANCH, BALK
New experimental statements to include :
SCHEDULES, VARIABLES
Additional work
1. Use the EXPORT command in the output processor (and optionally the FILTER command) to export the time variation of the inspection queue length as an ASCII text file. Read this file into a spreadsheet of your choice and generate a presentation quality graph.
Solution
| Number of type 1 jobs | 41 |
| Number of type 2 jobs | 63 |
| Number of balked jobs | 12 |
| Number of failed jobs |
The following three worksheets introduce no new concepts but will extend your understanding of the language features introduced so far.
WORKSHEET 5 :THE AIRLINE TICKET COUNTER (2)
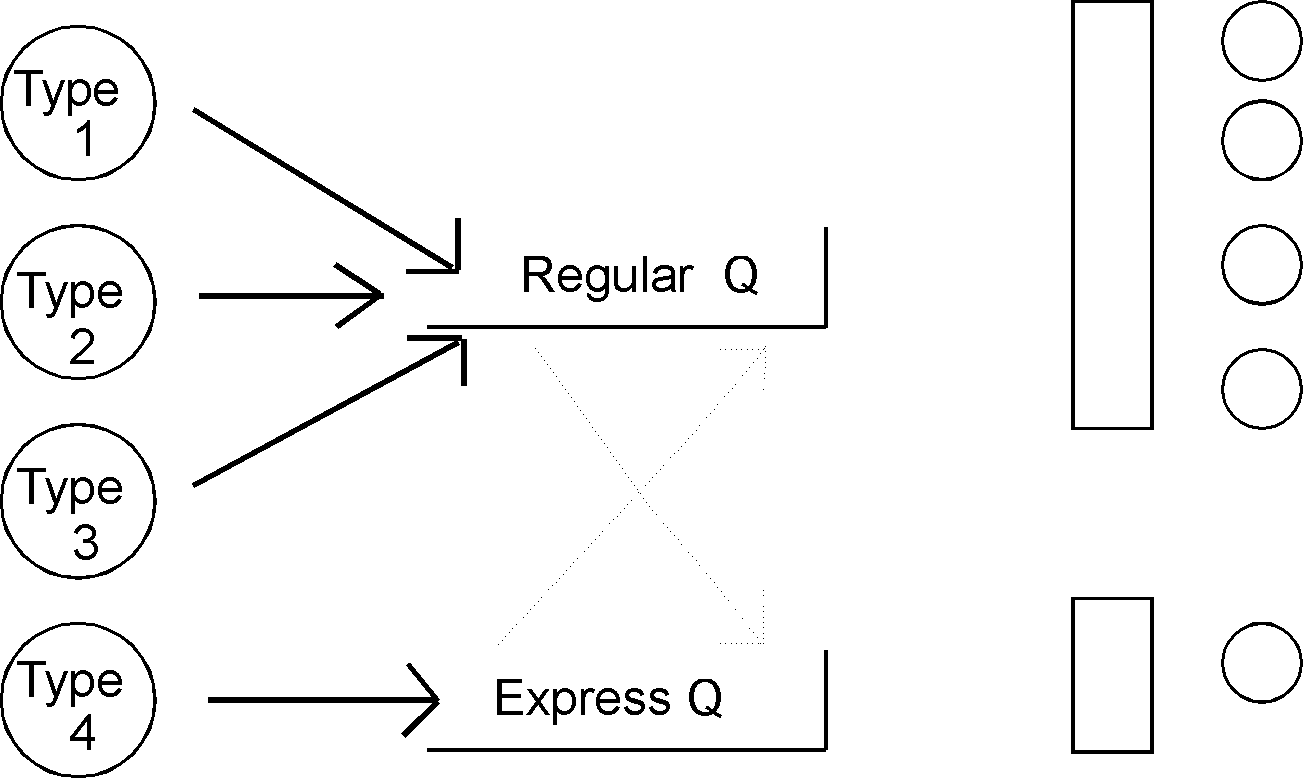
Modify the airline ticket counter model (Course work 3) to include an express agent, who serves "express customers", type 4. The time to process an express customer follows a triangular distribution (0.4, 0.55, 0.9). Collect time-in-system statistics on these new customers. The express counter is always staffed by one agent. Also modify the arrival process to be normal with mean 0.35 and standard deviation 0.1. The percentages of customer types are 35, 10, 4, 51 for types one through 4.
If a regular (type 1, 2, or 3) customer arrives and there is a waiting line for the regular ticket agents, the express agent will serve the customer if there is no one at the express counter. Likewise, if an express customer arrives and there is a waiting line at the express counter, but a regular agent is free, the customer will go to that agent.
Also, use an alternative method (than the seize block) to represent the shift changes for the regular ticket agents. Collect time-busy statistics on the regular agents and the express agent.

WORKSHEET 6 TELEPHONE MANUFACTURE
A telephone production line consists of assembly and inspection. Assembly time is triangular (51, 57, 69 mins.) a with weekly phone production requirement of 1800. Once 1800 have been assembled, the 20 assemblers clean until the end of the week, occasionally reworking phones that fail inspection. Each assembler works on one phone at a time and gets a new kit when completed. Assembly runs three 8 hour shifts, 5 days each week, with a half hour meal break 4 hours into each shift.
Phones fail inspection 10% of the time and inspection time is uniform (1.2, 2.5 mins.). Failed phones must be disassembled (triangular 26, 28, 35 mins.), then reassembled. Inspectors only work third shift. Inspectors are unreliable: 25% of the time all 6 inspectors turn up for work; 25%, 5; 20%, 4; 15%, 3; 15%, 2. After the inspectors' break, their productivity declines and maximum inspection time climbs to 3.2 minutes. Simulate the system for one week, keeping statistics on flow time, number of phones waiting for inspection, and the time left at the end of the week for assemblers to clean, etc.
No new statements required
Solution
| Average job flow time | 8.03 minutes |
| Average cleanup time | 15.55 minutes |
| Average No. Phones waiting inspection | 112.8 |


